The Science Behind Recovery Scores
A recovery score is not just a number. It is a composite of HRV, resting heart rate, sleep performance, and respiratory rate synthesized into a single daily signal. We break down exactly how it is calculated and why it works.
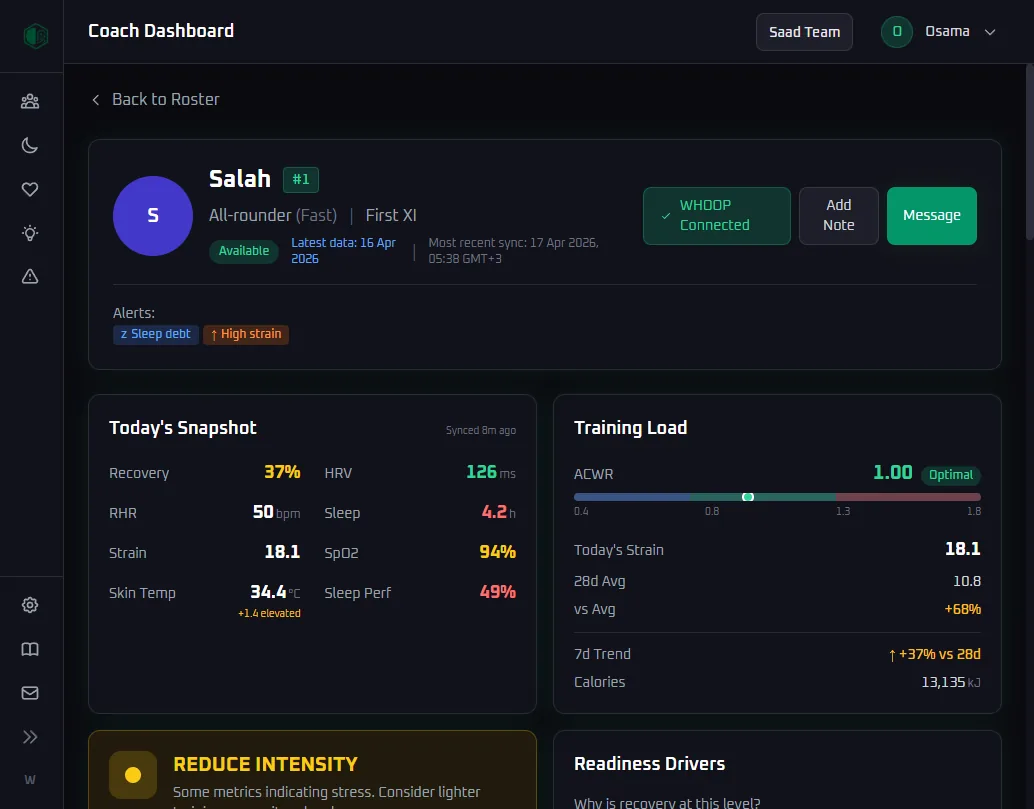
At Vector Connect, we believe the data your athletes already generate should lead to better decisions, not more spreadsheets. This piece looks at the question behind the headline above and what it means for the way you train and recover.
Why it matters
When recovery, sleep, and strain live in one place, patterns that used to hide in separate apps become obvious. Coaches can act earlier, athletes can understand their own bodies, and the whole team makes decisions from the same picture.
Full coverage of this topic is on the way. In the meantime, the Vector Connect dashboard already turns these signals into the readiness call you make today.